


Research on the influence analysis of Radar traveling time tomography in mine and parameter optimization
-
摘要: 矿井工作面内的隐伏灾害源是矿井安全生产的主要隐患,雷达波走时层析成像技术可实现大跨度开采区内隐伏灾害源的高精度探测。本文首先提出了层析成像精度评价标准,包括反演速度场和实际速度场速度差的方差、反演异常体中心偏离程度和大小偏离程度;其次通过正演模拟分析不同点间距、不同出射角度和不同反演网格参数对矿井地质雷达层析成像精度的影响规律,并对观测系统及反演参数进行优化;最后应用优化参数进行矿井雷达波走时层析成像探测实验,结果表明,在100 m跨度范围内可有效进行异常体的探测。本研究为矿井大跨度工作面内隐伏灾害源的快速精细探测提供有效的技术支撑。Abstract: Concealed hazard sources in the working face are the main hidden danger for safe production in the coal mines, and the Radar Travel Time Tomography technology can realize the high-precision detection of the concealed hazard source in the large-span working face.This paper puts forward an evaluation criteria for tomographic accuracy, including the evaluation indicators of variance of velocity difference between inversion velocity field and actual velocity field, deviation degree of the inversion center of the anomalous body, and deviation degree of the size of the anomalous body.Then the influence of radar traveling time tomography by point spacing, transmitting angle and inversion grid in mine is analyzed through forward modeling, resulting in the optimized parameters for observation system and inversion.Finally, the optimized parameters are employed to carry out some field verification experiments, and the results show that the anomalous body can be detected affectively for the working face within 100 m span, providing effective technical support for the rapid and precise detection of concealed hazard sources in large-span working face in mine area.
-

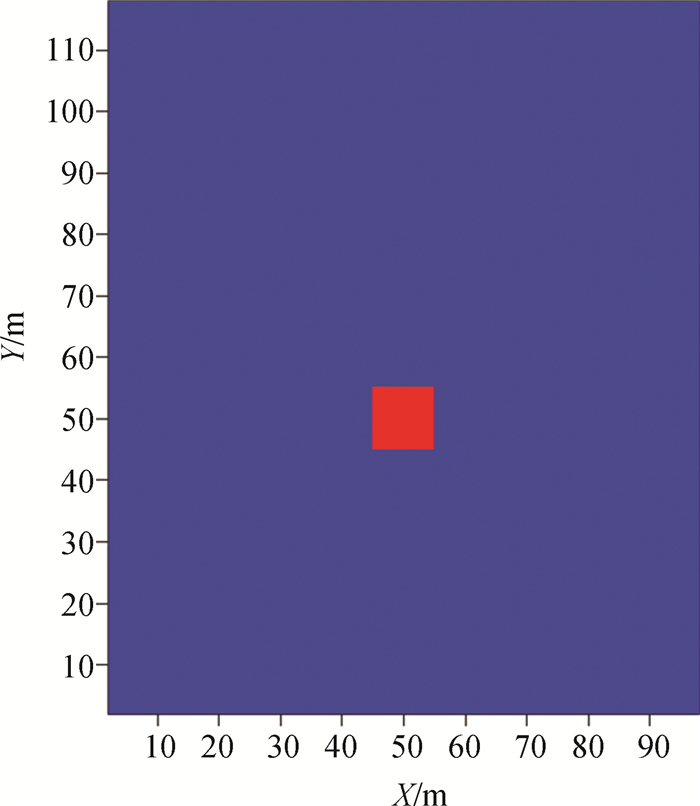
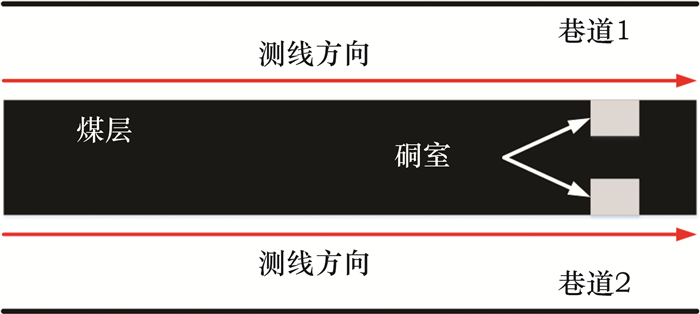
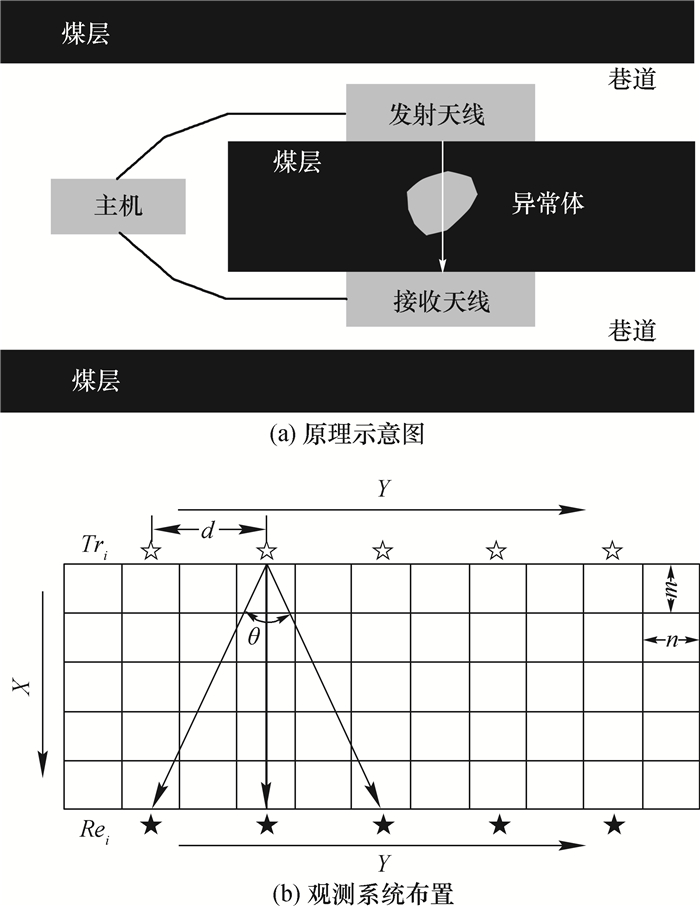
图 1 矿井雷达波走时层析成像技术示意图
d—观测点间距,m; θ—观测点间距,(°);m—反演网格宽度,m;n—反演网格长度,m;X—发射方向位置,m;Y—测线方向位置,m;☆—发射点;★—接收点
Figure 1. Schematic diagram of TIIRTT in mine

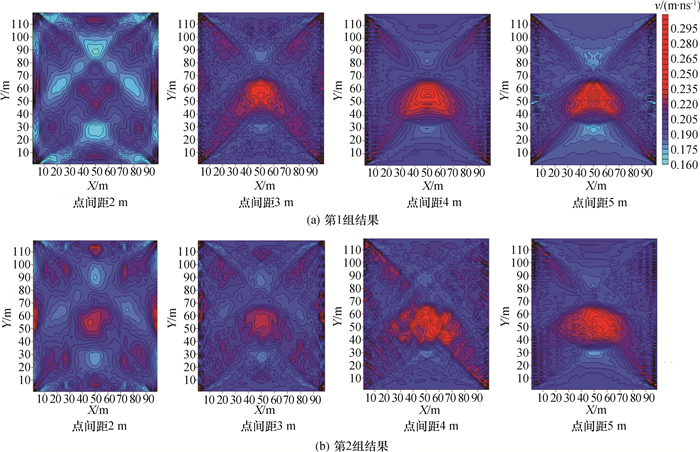
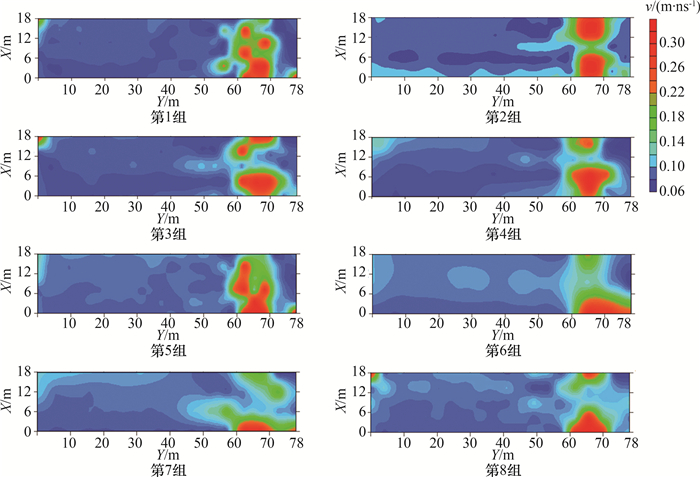
图 3 不同观测点间距条件下反演结果
v—电磁波传播速度,m/ns
Figure 3. Inversion result by different point spacing
表 1 专家评分结果
Table 1. Results of the expert rating
专家编号 指标 α β γ 1 0.15 0.45 0.40 2 0.25 0.40 0.35 3 0.20 0.35 0.45 4 0.25 0.45 0.30 5 0.15 0.35 0.50 平均 0.20 0.40 0.40 权重/% 20 40 40  下载: 导出CSV
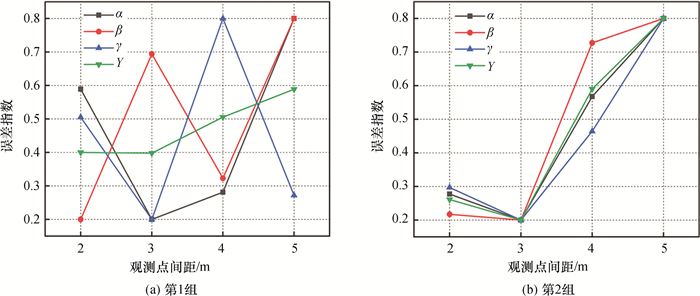
表 2 评价参数及Y值
Table 2. The evaluation indexes and Y value
实验组 d/m α β/m γ/m2 Y 1 2 0.011 1 6.534 7 87.979 4 0.399 9 3 0.008 7 9.387 8 43.959 2 0.397 7 4 0.009 2 7.244 0 130.517 8 0.505 4 5 0.012 4 9.998 9 54.332 3 0.588 8 2 2 0.008 1 8.273 4 66.431 3 0.261 1 3 0.007 7 8.249 9 46.026 8 0.200 0 4 0.009 6 8.972 6 101.621 3 0.590 2 5 0.010 8 9.072 2 172.228 0 0.800 0
下载: 导出CSV
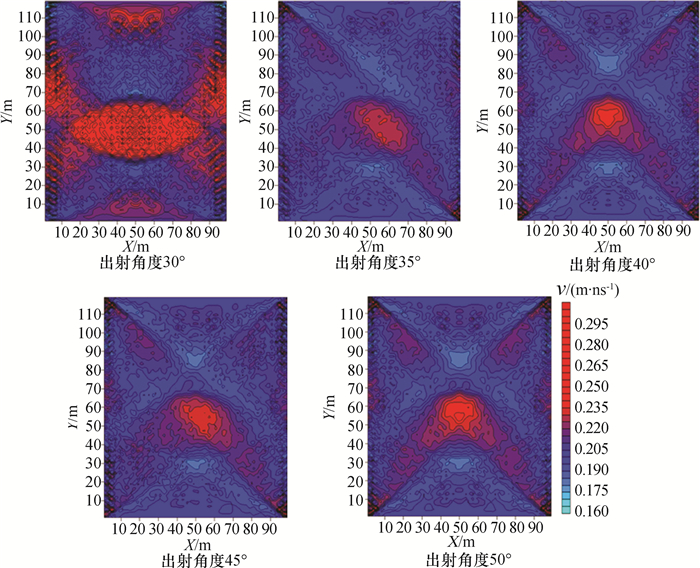
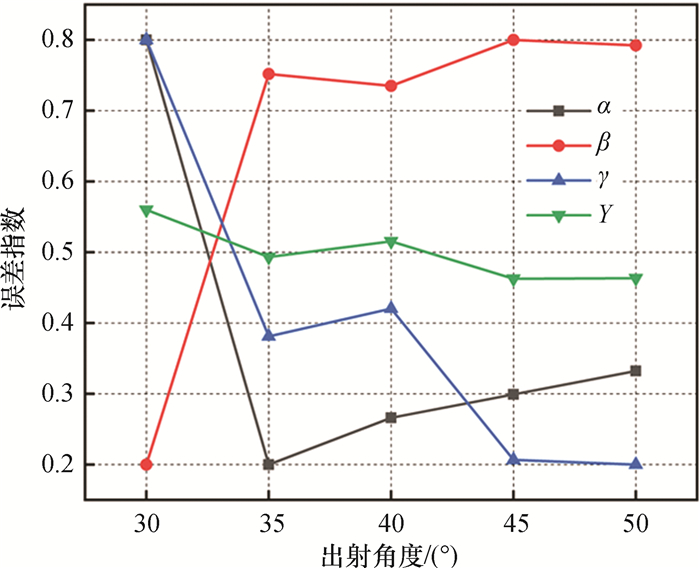
表 3 评价参数及Y值结果
Table 3. Results of the evaluation indexes and Y value
θ/(°) α β/m γ/m2 Y 30 0.018 6 0.673 8 397.167 0 0.560 0 35 0.005 9 8.793 8 150.653 8 0.493 5 40 0.007 3 8.544 2 173.666 3 0.515 6 45 0.008 0 9.499 2 47.925 4 0.462 5 50 0.008 7 9.387 8 43.959 2 0.463 6
下载: 导出CSV
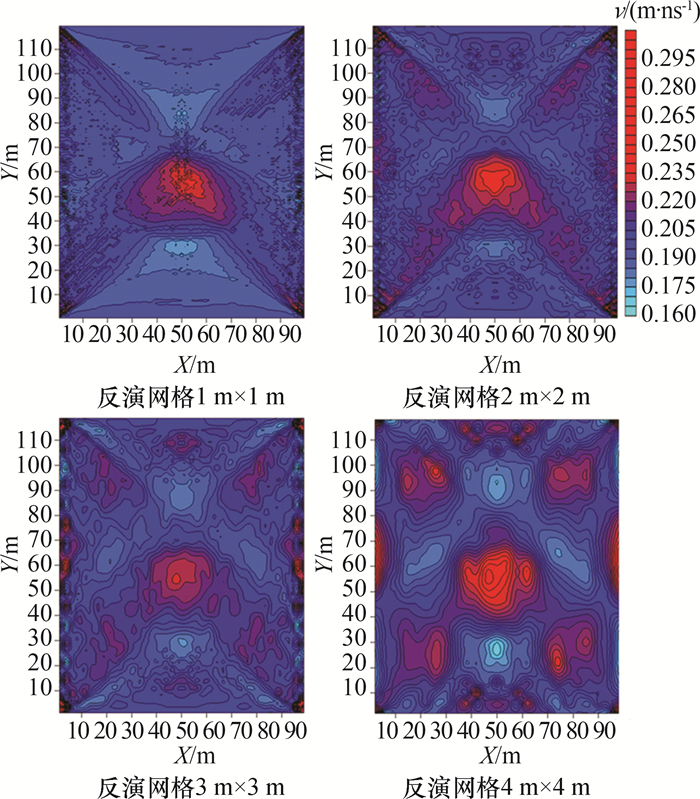
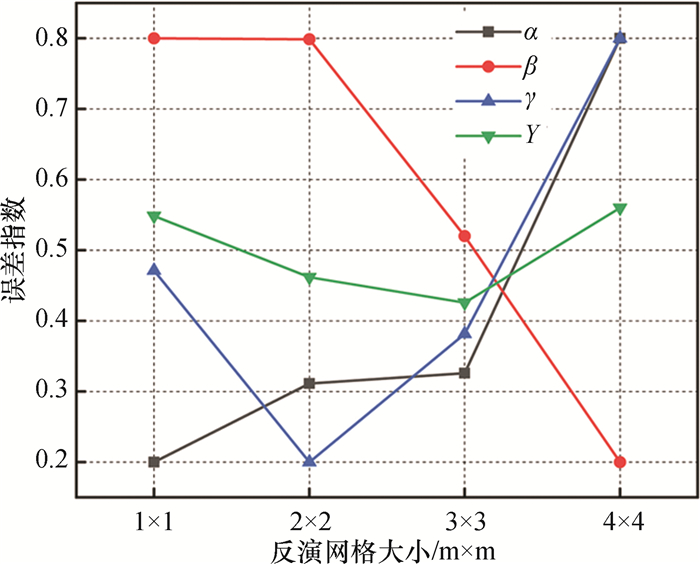
表 4 评价参数及Y值结果
Table 4. Results of the evaluation indexes and Y value
m×n/m×m α β/m γ/m2 Y 1×1 0.005 7 9.501 5 63.230 7 0.548 5 2×2 0.008 0 9.499 2 47.925 4 0.461 7 3×3 0.008 3 9.005 4 58.167 7 0.425 8 4×4 0.018 1 8.438 5 81.778 5 0.560 0
下载: 导出CSV
表 5 评价参数结果
Table 5. Results of the evaluation indexes
α β/m γ/m2 0.000 328 13.726 4 297.454 5
下载: 导出CSV
表 6 参数及探测精度评价
Table 6. Parameters and accuracy evaluation results
实验组 d/m θ/(°) m×n/m×m Y 1 3 45 2×2 0.289 2 2 3 45 3×3 0.213 5 3 3 50 2×2 0.325 3 4 3 50 3×3 0.452 8 5 6 45 2×2 0.678 3 6 6 45 3×3 0.725 8 7 6 50 2×2 0.763 7 8 6 50 3×3 0.687 5
下载: 导出CSV
-
[1] Leopold M, Völkel J, Huber J, et al. Subsurface architecture of the Boulder Creek Critical Zone Observatory from electrical resistivity tomography[J]. Earth Surface Processes and Landforms, 2013: 38: 1417-1431. http://czo.colorado.edu/pub/2013/Leopold.ESPL2013.pdf [2] Liu S X, Liu X T, Meng X, et al. Application of time-domain full waveform inversion to cross-hole radar data measured at Xiuyan jade mine, China[J]. Sensors, 2018, 18(9): 25-35. http://www.onacademic.com/detail/journal_1000040848503310_fe4e.html [3] 赵旭辰, 李雪健, 曹芳智. 井间电磁波CT在煤矿采空区探测效果分析[J]. 物探与化探, 2021, 45(4): 1088-1094. https://www.cnki.com.cn/Article/CJFDTOTAL-WTYH202104032.htmZhao Xuchen, Li Xuejian, Cao Fangzhi. An analysis of the detection effect of cross-well electromagnetic wave CT in coal mine goaf[J]. Geophysical and Geochemical Exploration, 2021, 45(4): 1088-1094. https://www.cnki.com.cn/Article/CJFDTOTAL-WTYH202104032.htm [4] 李东, 杜文凤, 许献磊. 矿井地质雷达超前探测方法及应用研究[J]. 煤炭科学技术, 2018, 46(7): 223-228.Li Dong, Du Wenfeng, Xu Xianlei. Study on advanced detection method and application of mine geological radar[J]. Coal Science and Technology, 2018, 46(7): 223-228. [5] 董全令. 井下隐伏构造灾害源低频探地雷达CT探测研究[J]. 能源与节能, 2019(7): 87-88, 103. doi: 10.3969/j.issn.2095-0802.2019.07.040Dong Quanling. Research on CT detection of underground hidden structural disaster source by low frequency ground penetrating radar[J]. Energy and Energy Conservation, 2019(7): 87-88, 103. doi: 10.3969/j.issn.2095-0802.2019.07.040 [6] Vidale J E. Finite-difference calculation of traveltimes in three dimensions[J]. GEOPHYSICS, 1990, 55(5): 521-526. doi: 10.1190/1.1442863 [7] Carbonel D, Rodríguez V, Gutiérrez F, et al. Evaluation of trenching, ground penetrating radar (GPR) and electrical resistivity tomography (ERT) for sinkhole characterization[J]. Earth Surface Processes and Landforms, 2014, 39(2): 214-227. doi: 10.1002/esp.3440 [8] Schmitt M, Stilla U. Maximum-likelihood-based approach for single-pass synthetic aperture radar tomography over urban areas[J]. IET Radar, Sonar and Navigation, 2014, 8(9): 1145-1153. doi: 10.1049/iet-rsn.2013.0378 [9] 杜翠. 矿井复杂构造雷达波走时层析成像反演算法研究[D]. 北京: 中国矿业大学, 2015. [10] Tronicke J, Tweeton D R, Dietrich P, et al. Improved crosshole radar tomography by using direct and reflected arrival times[J]. Journal of Applied Geophysics, 2001, 47(2): 97-105. doi: 10.1016/S0926-9851(01)00050-7 [11] 曾奇, 余海忠, 孙泽会. 钻孔雷达层析成像法探测地下岩溶的数值模拟[J]. 城市勘测, 2020(3): 181-187. doi: 10.3969/j.issn.1672-8262.2020.03.043Zeng Qi, Yu Haizhong, Sun Zehui. Numerical simulation of underground Karst detection by borehole radar tomography[J]. Urban Geotechnical Investigation & Surveying, 2020(3): 181-187. doi: 10.3969/j.issn.1672-8262.2020.03.043 [12] 刘征宇, 庞永昊, 王传武. 基于不完整边界先验信息的跨孔电阻率CT反演方法研究[J]. 岩土工程学报, 2019, 41(6): 1124-1132.Liu Zhengyu, Pang Yonghao, Wang Chuanwu. Cross-hole resistivity inversion method constrained by prior information of incomplete boundary[J]. Chinese Journal of Geotechnical Engineering, 2019, 41(6): 1124-1132. [13] Cheng F, Liu J P, Wang J, et al. Multi-hole seismic modeling in 3-D space and cross-hole seismic tomography analysis for boulder detection[J]. Journal of Applied Geophysics, 2016, 134: 246-252. doi: 10.1016/j.jappgeo.2016.09.014 [14] 张业. 跨孔雷达层析成像探测地下异常体的数值模拟[J]. 铁道勘察, 2017, 43(5): 66-69. doi: 10.3969/j.issn.1672-7479.2017.05.020Zhang Ye. Numerical simulation of cross-hole radar tomography in subsurface anomaly detection[J]. Railway Investigation and Surveying, 2017, 43(5): 66-69. doi: 10.3969/j.issn.1672-7479.2017.05.020 [15] 孟旭, 刘四新, 吴俊军, 等. 时间域跨孔雷达全波形反演及实际应用[J]. 世界地质, 2016, 35(1): 256-263. doi: 10.3969/j.issn.1004-5589.2016.01.027Meng Xu, Liu Sixin, Wu Junjun, et al. Full waveform inversion of time-domain cross-hole radar and its field application[J]. Global Geology, 2016, 35(1): 256-263. doi: 10.3969/j.issn.1004-5589.2016.01.027 [16] Bhuiyan M A, Al Hasan M. An iterative MapReduce based frequent subgraph mining algorithm[J]. IEEE Transactions on Knowledge and Data Engineering, 2015, 27(3): 608-620. doi: 10.1109/TKDE.2014.2345408 [17] 聂万印. 采煤工作面内隐伏断层震波CT联合反演技术研究与应用[J]. 煤炭与化工, 2019, 42(5): 69-72.Nie Wanyin. Study and application of joint inversion technology of concealed fault wave CT in coal mining face[J]. Coal and Chemical Industry, 2019, 42(5): 69-72. -


 点击查看大图
计量
- 文章访问数: 361
- HTML全文浏览量: 161
- PDF下载量: 31
- 被引次数: 0